Page Performance · Speed Audit · Core Web Vitals
Website Speed Test: Which Tools to Use, How to Read Results & What to Fix
Most website owners run a speed test — then have no idea what to do next. This guide changes that.
Running a website speed test is the first step every site owner should take — but it’s only useful if you understand what the numbers mean and what actions to take next.
Google has confirmed that page speed is a direct ranking signal. A slow site doesn’t just frustrate users — it actively gets penalised in search results, costing you traffic, leads, and revenue.
In this guide, we cover the best tools to test your site’s speed, how to interpret every key metric, and the exact fixes that move the needle — explained in plain language, no jargon.
📋 Table of Contents
Why Running a Speed Test Actually Matters
Most people assume their website is “fast enough.” The reality? According to Google’s own data, the majority of websites still fail Core Web Vitals — even well-maintained ones.
A website speed test gives you hard numbers instead of assumptions. It tells you your actual load time, which specific files are slowing things down, and how your site compares to Google’s performance thresholds.
Without this data, any optimisation effort is guesswork. With it, you know exactly where to focus for the biggest impact.
💡 Key Fact: A 1-second improvement in page load time can increase conversions by up to 7%, according to research cited by Cloudflare.
The Best Website Speed Test Tools in 2026
Not all speed testing tools are created equal. Each one measures slightly different things and presents data differently — so knowing which tool to use for what purpose saves you a lot of confusion.
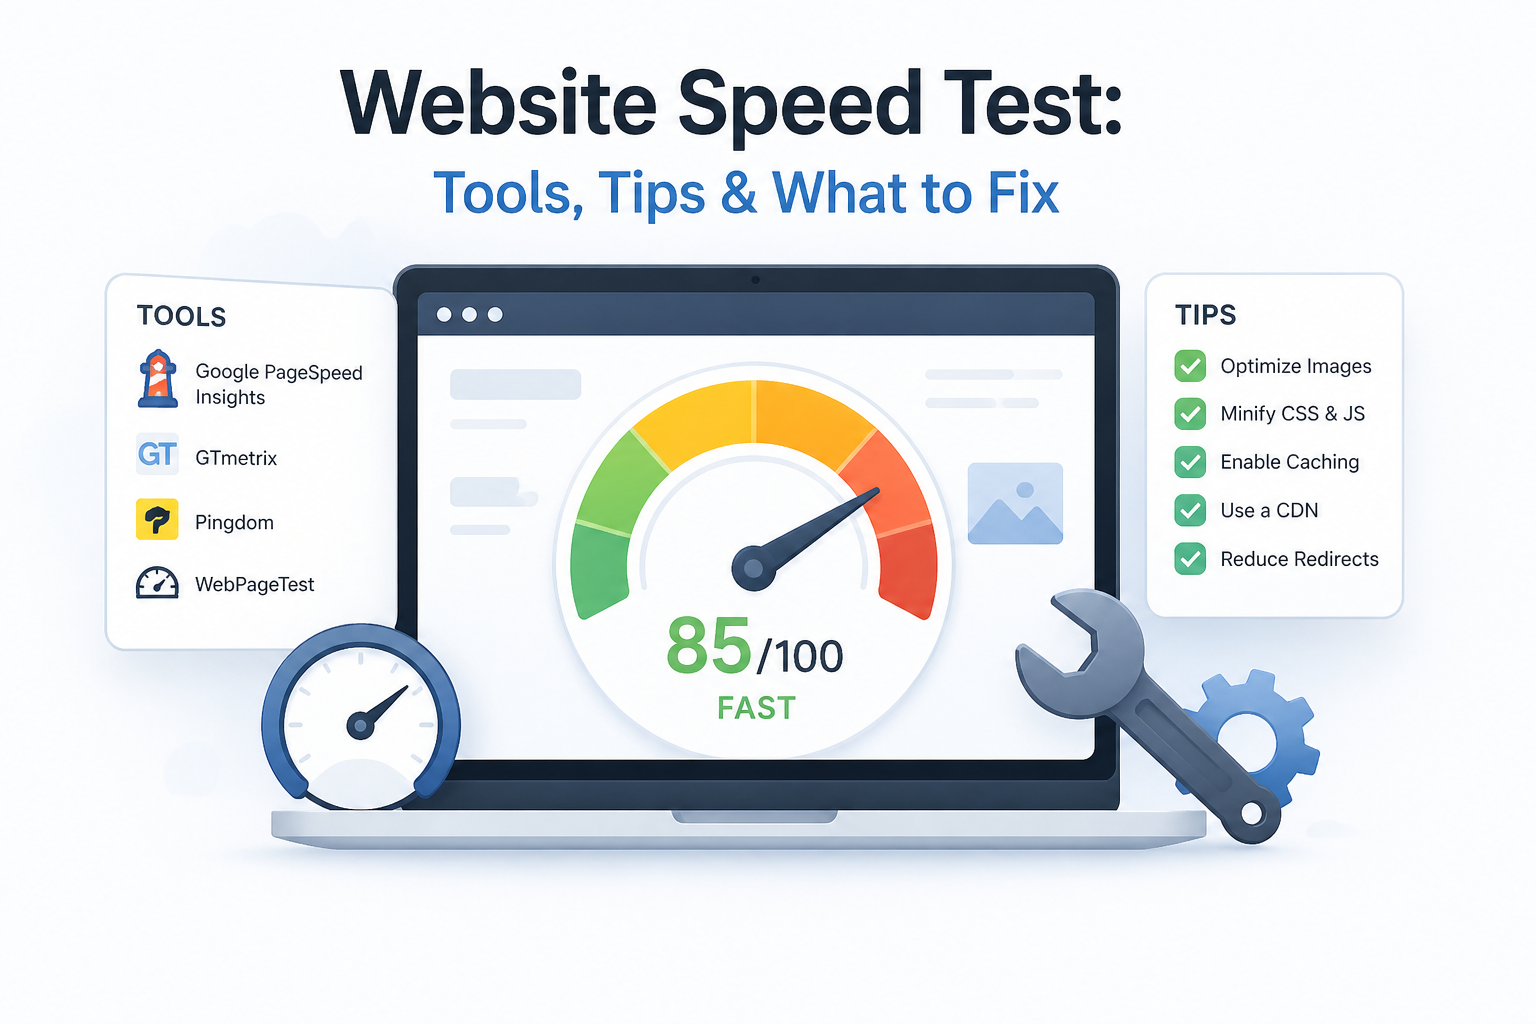
Here are the four tools we recommend, and when to use each one:
The gold standard — uses real Chrome user data alongside lab data. Directly reflects how Google sees your site. Use this first, always.
Excellent for waterfall analysis — shows you exactly which files load in what order and how long each takes. Ideal for diagnosing specific bottlenecks.
Advanced and highly configurable — test from specific locations, device types, and connection speeds. Best for technical deep-dives.
Not a traditional speed tester, but the Core Web Vitals report here shows real-world field data for every URL on your site — invaluable for ongoing monitoring.
How to Read Your Speed Test Results
Speed test reports can feel overwhelming at first glance — dozens of metrics, colour-coded scores, and technical recommendations. But you only need to focus on a handful of numbers.
Your Performance Score (0–100) gives a quick overall snapshot. Aim for 90+ on desktop and 70+ on mobile. Below 50 means your site has serious issues that need immediate attention.
The Opportunities and Diagnostics sections beneath the score are where the real value is — they list specific, actionable issues ranked by how much they’re slowing you down.
🔗 Related: Already have your test results? Website Ka Doctor can interpret your report and fix every issue found — with no technical knowledge needed on your end.
Core Web Vitals Explained Simply
Core Web Vitals are three specific metrics Google uses to measure real-world user experience. They appear in every speed test report and carry direct ranking weight — so they deserve your full attention.
Each metric has a clear “Good,” “Needs Improvement,” and “Poor” threshold. The goal is to get all three into the green across your most important pages.
LCP
Largest Contentful Paint
Measures how fast the main content loads. Good = under 2.5s
INP
Interaction to Next Paint
Measures click/tap responsiveness. Good = under 200ms
CLS
Cumulative Layout Shift
Measures visual stability. Good = under 0.1
Most Common Issues Speed Tests Uncover
After analysing thousands of sites, the same performance problems show up again and again. Knowing what to expect helps you move from “here’s what’s wrong” to “here’s how to fix it” much faster.
The most frequent culprits flagged in speed test reports are unoptimised images, render-blocking JavaScript, missing browser caching, slow server response times, and excessive third-party scripts like chat widgets and ad trackers.
Third-party scripts deserve special attention — a single poorly-loaded chat widget or analytics tag can add 500ms or more to your load time. Google’s guidance on third-party impact is worth reading if your score is dragged down by these.
How to Fix What the Speed Test Finds
Once you have your results, tackle fixes in order of estimated savings — which PageSpeed Insights conveniently shows for you. Start with the highest-impact items before touching anything else.
For images, convert to WebP or AVIF format and add loading="lazy" to everything below the fold. for code, minify CSS and JavaScript, and enable GZIP or Brotli compression on your server.
For server speed, your TTFB (Time to First Byte) should be under 200ms — if it’s not, your hosting is the bottleneck. Consider moving to a faster host or enabling a CDN like Cloudflare to serve content closer to each visitor.
✅ Post-Speed-Test Fix Checklist
- ✔ Convert images to WebP/AVIF & add lazy loading
- ✔ Minify CSS, JS, and HTML across all pages
- ✔ Enable GZIP or Brotli compression on the server
- ✔ Set up browser caching & connect a CDN
- ✔ Defer or async-load render-blocking JavaScript
- ✔ Audit and remove unnecessary third-party scripts
- ✔ Get TTFB below 200ms (upgrade hosting if needed)
- ✔ Re-run speed test after each batch of fixes to confirm improvement
Speed Tests & Google Recovery
If your site lost rankings after a Google algorithm update, a website speed test should be your very first diagnostic step. Many sites that fall into the category of google recovery sites discover that slow Core Web Vitals scores — not thin content — were the actual cause of their traffic drop.
Google’s algorithm has become increasingly sensitive to real-world user experience signals. A site that used to rank on older signals — like backlinks and keyword density alone — can now fall if its page experience score doesn’t meet the threshold.
The good news: speed-related ranking drops typically recover within 2–4 weeks once genuine fixes are applied. After optimising, submit your sitemap in Google Search Console and request indexing on your key pages to speed up re-crawling.
🔗 Also Read: Explore the full range of website health and SEO services at Website Ka Doctor — diagnosis, optimisation, and ongoing performance monitoring all in one place.
Website Ka Doctor
Not Sure What Your Speed Test Results Mean?
We analyse your full speed test report, identify exactly what’s hurting your rankings, and implement every fix — from image compression to server-level optimisation.
Whether you’re chasing a faster score or recovering from a Google ranking drop, our team delivers measurable, lasting results.
No commitment needed · Detailed report within 24 hours
Final Thoughts
A website speed test is not a one-time task — it’s a habit. Run one after every major site update, plugin change, or new content push. What scores well today can break tomorrow if a new script or image slips through unchecked.
The tools are free, the data is right there, and the impact on your rankings and conversions is very real. There’s genuinely no good reason to be flying blind on your site’s performance in 2026.
If you want someone to handle the entire process — testing, interpreting, fixing, and monitoring — Website Ka Doctor is built precisely for that. Think of us as your site’s personal performance physician.
Website Ka Doctor
We specialise in website speed, Core Web Vitals, and SEO performance — diagnosing every issue and restoring your site to full health.