Website Ka Doctor — Website Debugging & Repair Guide
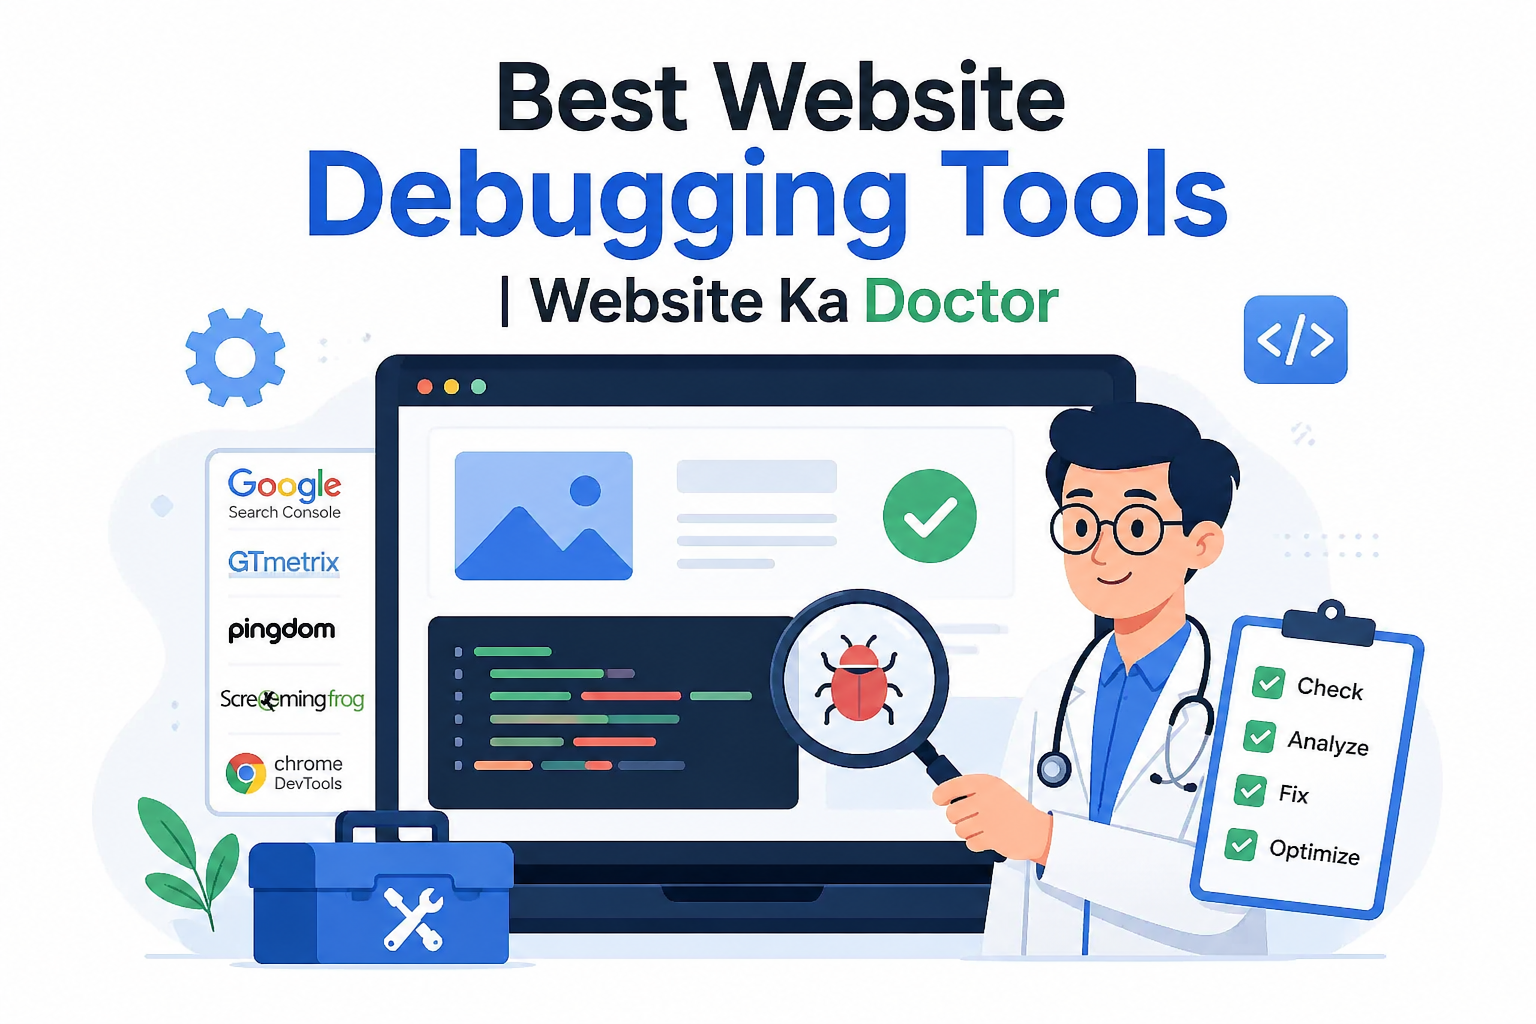
Best Website Debugging Tools — Find & Fix Errors Like a Pro
A practical guide to the tools experts use to diagnose website problems — and when to call in professional help.
⚡ Quick Answer
The best website debugging tools include Google Search Console, Chrome DevTools, Google PageSpeed Insights, GTmetrix, Screaming Frog, and WordPress Site Health. Together, these tools help you identify crawl errors, broken pages, slow load times, and security issues. Website Ka Doctor uses all of these — plus professional expertise — to fix Indian websites fast.
Every website develops problems over time. A plugin update breaks a layout, a database query throws an error, or Google suddenly stops indexing your pages without any obvious reason.
The difference between a business owner who loses weeks of traffic and one who resolves the issue in hours often comes down to one thing: knowing which tools to use and how to read what they tell you.
This guide walks you through the most effective website debugging tools available today — each explained in plain English with a clear purpose and use case.
68%
of website downtime is caused by fixable technical errors
53%
of mobile visitors leave if a page takes over 3 seconds to load
1 in 4
Indian business websites have at least one critical technical error
What Is Website Debugging and Why Does It Matter?
Website debugging is the process of identifying, analysing, and fixing errors that prevent your website from working correctly. These errors can be visible — like a broken layout or a 404 page — or completely hidden, silently hurting your speed, security, or Google rankings.
For Indian small businesses, an undiagnosed website error can mean lost leads, lost sales, and a damaged reputation — often without the business owner even knowing what went wrong.
Using the right debugging tools turns a frustrating guessing game into a structured, solvable process. Here are the best ones, explained clearly.
Tool 1 — Google Search Console
Google Search Console is the single most important free tool for any website owner. It shows you exactly how Google sees your site — which pages are indexed, which have crawl errors, and whether any manual actions or security issues have been flagged.
If your website has been hacked or penalised, Google Search Console is where the alerts appear first. It is also the platform through which you submit a review request as part of the google recovery process after cleaning a compromised site.
Set this up the moment you launch a website. It is free, official, and irreplaceable for diagnosing why a site is not appearing in search results.
Tool 2 — Chrome DevTools (Browser Developer Tools)
Built directly into Google Chrome, Chrome DevTools is the go-to tool for diagnosing front-end errors. Press F12 on any page and you get instant access to the Console, Network tab, and Elements panel.
The Console tab shows JavaScript errors in real time. The Network tab reveals slow-loading resources, failed requests, and blocked scripts that are silently damaging your user experience.
Even without coding knowledge, the red error messages in the Console tab alone can tell you exactly which part of your site is broken and what needs attention.
Tool 3 — Google PageSpeed Insights
Speed is a confirmed Google ranking factor, and Google PageSpeed Insights is the authoritative tool to measure it. It scores your site on both desktop and mobile, then lists the specific issues dragging your performance down.
The report highlights Core Web Vitals — Google’s user experience metrics that directly influence rankings. Issues like unoptimised images, render-blocking JavaScript, and missing caching are all surfaced here with clear recommendations.
A score below 50 on mobile is a serious problem for any Indian business website competing in local search results. Fixing the flagged issues can produce rapid ranking improvements.
🔧 Website Errors You Can’t Diagnose Yourself?
Website Ka Doctor runs a full professional diagnosis of your website — covering technical errors, security issues, speed problems, and Google visibility. Get a free check today.
Tool 4 — GTmetrix
GTmetrix goes deeper than PageSpeed Insights by providing a waterfall chart that shows every single resource loading on your page — and how long each one takes. This makes it invaluable for identifying bottlenecks that general speed scores miss.
For Indian websites hosted on shared servers, GTmetrix often reveals third-party scripts, chat widgets, or analytics tools that are quietly adding two to four seconds of load time without the owner realising.
The free version is sufficient for most diagnostics. It allows you to test from multiple server locations and monitor performance changes over time.
Tool 5 — Screaming Frog SEO Spider
Screaming Frog is a desktop-based website crawler used by SEO professionals worldwide. It mimics how Googlebot crawls your site and surfaces every issue it encounters — broken links, redirect chains, missing meta tags, duplicate content, and much more.
For a business website with more than 20 pages, a Screaming Frog audit provides a comprehensive map of every technical problem that needs attention. The free version supports up to 500 URLs — more than enough for most small Indian business sites.
Professionals at Website Ka Doctor use this tool as part of every full website technical audit before beginning a repair or SEO recovery project.
Tool 6 — WordPress Site Health & Debug Mode
For WordPress websites specifically, the built-in Site Health tool (found under Tools > Site Health in the dashboard) checks your installation against a list of recommended configurations and flags critical issues like outdated PHP, insecure settings, and plugin conflicts.
When a WordPress site breaks unexpectedly, enabling debug mode in the wp-config.php file by setting WP_DEBUG to true reveals the exact PHP error causing the crash. According to WordPress’s official debugging documentation, this is always the recommended first step for troubleshooting a broken WordPress site.
However, always disable debug mode on a live site after diagnosis. Leaving it active displays raw error messages to visitors, which is both a poor user experience and a security risk.
Tool 7 — Google Safe Browsing Transparency Report
If your website has been hacked or infected with malware, Google may have flagged it as dangerous. The Google Safe Browsing Transparency Report lets you check your domain instantly to see if it has been blacklisted.
This is the starting point for any google recovery site scenario. If your domain shows up as unsafe, your site has been removed from search results and visitors are actively being warned away. Every hour this persists means more lost traffic and trust.
The recovery process involves cleaning the site completely, verifying the fix, and submitting a formal review request through Google Search Console. This is a precise, multi-step process that Website Ka Doctor handles end-to-end for Indian businesses.
⚠️ When Debugging Tools Are Not Enough — Get Professional Help
1 Database corruption or server-level errors require expert access
2 Malware buried in obfuscated code will not show up on standard scanners
3 Google manual actions require a specific recovery process that varies by violation type
4 Plugin conflicts after an update can cascade and require careful rollback procedures
5 Attempted DIY repairs without backups can make problems permanently unrecoverable
Quick Comparison — Which Tool Does What
Not every tool solves every problem. Here is a clear summary of what each debugging tool is best used for:
Professional Debugging & Repair Services by Website Ka Doctor
🔧Website Repair – Fix broken, crashed, or error-throwing websites fast.
🛡️Malware Removal – Deep clean infected files & restore Google safety status.
🚀Speed Optimisation – Improve Core Web Vitals & PageSpeed score for better rankings.
📈Google Penalty Recovery – Diagnose & fix manual actions to restore lost rankings.
Frequently Asked Questions
Website Ka Doctor — Professional Website Debugging & Repair
Found an Error? Let Us Fix It.
Website Ka Doctor uses professional-grade debugging tools and expert knowledge to diagnose and repair Indian websites fast — from simple errors to full Google recovery cases. No guesswork. No downtime.
Free diagnosis • No downtime • Trusted by Indian businesses
Website Ka Doctor Team
Debugging, Repair & Recovery Specialists — India
Website Ka Doctor helps Indian businesses identify and fix every type of website error — from front-end bugs and performance issues to malware infections and Google ranking drops. Our team uses the same professional tools described in this guide, backed by hands-on expertise. Visit websitekadoctor.com →